Hayabusa SPICE Data Issues
========================================================================
By Boris Semenov, NAIF/JPL, July 16, 2010
Introduction
------------
This document provides a brief discussion of the analysis of the
Hayabusa SPICE kernels done in the course of preparation of the
Hayabusa SPICE PDS data set, the issues with the data discovered by
that analysis, and additional kernel files produced to address some
of those issues. This document consists of four sections, each
covering particular kernels created by a particular producer:
-- SPK files created by the Hayabusa Joint Science Team (HJST)
-- SPK file created by Dr. Olivier S. Barnouin-Jha
-- CK files created by HJST
-- SCLK file created by HJST
SPK Files Created by HJST
-------------------------
The set of SPK files produced by Hayabusa Joint Science Team (HJST)
included 84 short-coverage SPKs named
"hayabusa_YYYYMMDD_yyyymmdd_v01.bsp", covering from one to a few
days, produced on a regular basis during operations at Itokawa, and
one long-coverage SPK named "hayabusa_itokawarendezvous_v01.bsp",
covering the whole period of operation at Itokawa, produced at the
end of the operations at Itokawa. Both the short-coverage SPKs and
the long-coverage SPK were created by packaging the spacecraft
position and velocity relative to Itokawa determined on-board into
Type 9 (Lagrange interpolation)/degree 1 SPK segments using the
MKSPK program.
During the archive preparation the contents of the short-coverage
and long-coverage HJST SPKs were dumped using the SPICE Toolkit's
SPY program and the dumps were compared to verify that the data
stored in the files indeed came from the same source. The comparison
showed that this was the case and that the total set of points in
all short-coverage SPKs was a subset of points from the
long-coverage SPK. Because of this the long-coverage SPK was
considered as superseding the short-coverage SPKs and was the only
HJST SPK used in further analysis.
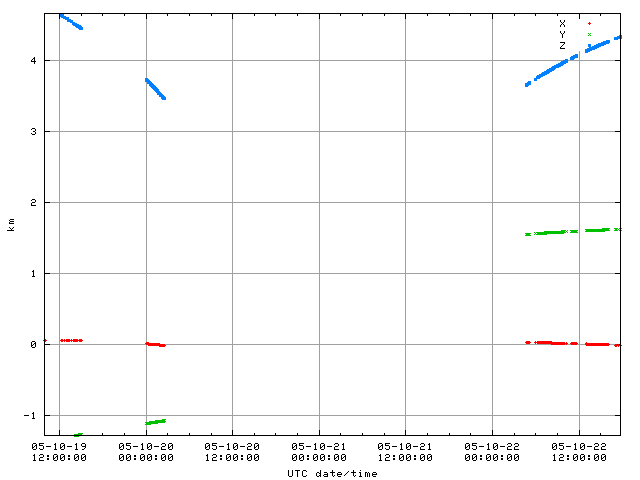
The positions dumped from the long-coverage SPK were plotted in a
variety of ways, one of which was the plot Figure 1 showing the X, Y,
and Z components of the Hayabusa position relative to Itokawa in the
HAYABUSA_HP reference frame (+Z axis along the geometric direction
from Itokawa to the Earth; +X axis as close as possible to the
geometric direction from Itokawa to the Sun; +Y axis completing the
right-handed frame):
Figure 1
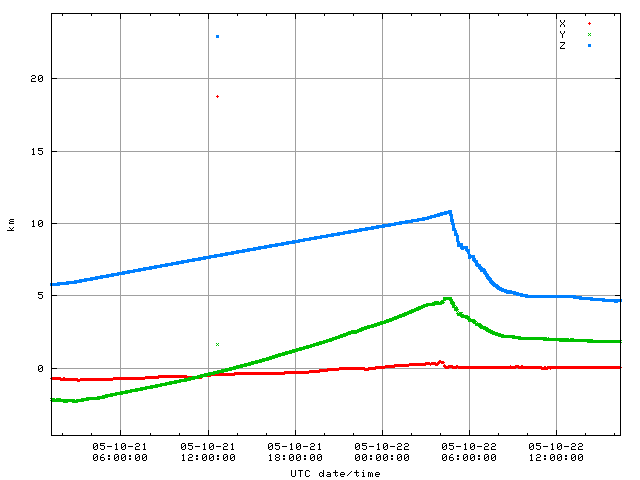
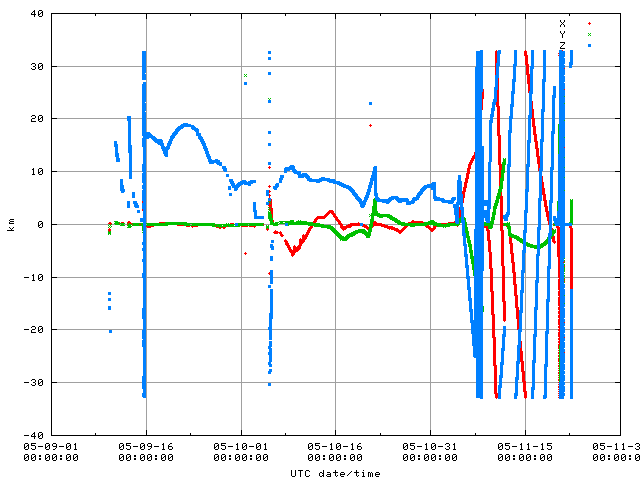 Plotting the data demonstrated that the set of positions stored in
the long-coverage HJST SPK included a few obvious outliers, such as
the one seen on this zoom-in plot Figure 2:
Figure 2
Plotting the data demonstrated that the set of positions stored in
the long-coverage HJST SPK included a few obvious outliers, such as
the one seen on this zoom-in plot Figure 2:
Figure 2
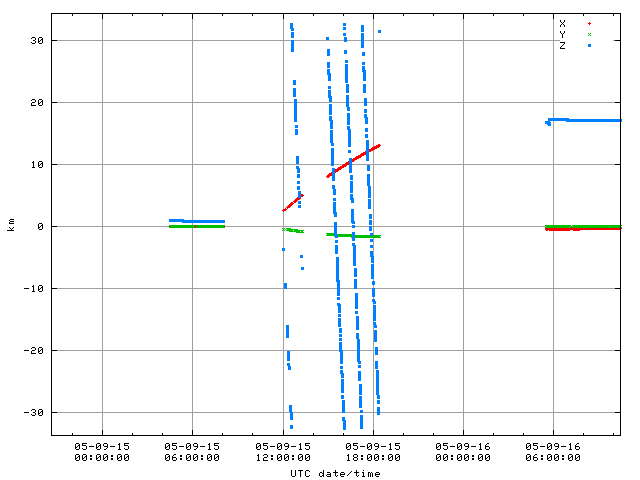
 Moreover the plots showed that the data during some intervals did
not make physical sense, with the trends in the Z coordinate
indicating the spacecraft moving from a position about 30 km in
front of Itokawa to a position about 30 km behind Itokawa and then
"jumping" back to the front multiple times in a short period of
time, as seen on this zoom-in plot Figure 3:
Figure 3
Moreover the plots showed that the data during some intervals did
not make physical sense, with the trends in the Z coordinate
indicating the spacecraft moving from a position about 30 km in
front of Itokawa to a position about 30 km behind Itokawa and then
"jumping" back to the front multiple times in a short period of
time, as seen on this zoom-in plot Figure 3:
Figure 3
 All of these anomalies were documented in the comments added to the
long-coverage HJST SPK. In addition to that the dumped data were
"cleaned" to eliminate the outlier points and points during
anomalous periods, split into chunks to prohibit interpolation over
large gaps resulting from elimination of anomalous data, and
repackaged using the same MKSPK setup parameters as those that were
used to make the original long-coverage HJST SPK into a new SPK file
named "hay_jaxa_050916_051119_v1n.bsp".
SPK File Created by Dr. Olivier S. Barnouin-Jha
-----------------------------------------------
The SPK file created by Dr. Olivier S. Barnouin-Jha was originally
named "Sept-Nov_SPK.bsp". In order to be included in the archive
it was renamed to "hay_osbj_050911_051118_v1.bsp". This file was
created in October 2008 and covered the whole period of operation at
Itokawa. It was created by packaging the discrete position data
points determined from Hayabusa LIDAR and WAC data into a Type 9
(Lagrange interpolation)/degree 1 SPK using the MKSPK program.
During the archive preparation the positions stored in the file were
dumped using the SPY program and rotated to the HAYABUSA_HP frame.
Then they were plotted in a variety of ways, one of which was the
plot Figure 4 showing the X, Y, and Z components of the Hayabusa
position relative to Itokawa in the HAYABUSA_HP reference frame:
Figure 4
All of these anomalies were documented in the comments added to the
long-coverage HJST SPK. In addition to that the dumped data were
"cleaned" to eliminate the outlier points and points during
anomalous periods, split into chunks to prohibit interpolation over
large gaps resulting from elimination of anomalous data, and
repackaged using the same MKSPK setup parameters as those that were
used to make the original long-coverage HJST SPK into a new SPK file
named "hay_jaxa_050916_051119_v1n.bsp".
SPK File Created by Dr. Olivier S. Barnouin-Jha
-----------------------------------------------
The SPK file created by Dr. Olivier S. Barnouin-Jha was originally
named "Sept-Nov_SPK.bsp". In order to be included in the archive
it was renamed to "hay_osbj_050911_051118_v1.bsp". This file was
created in October 2008 and covered the whole period of operation at
Itokawa. It was created by packaging the discrete position data
points determined from Hayabusa LIDAR and WAC data into a Type 9
(Lagrange interpolation)/degree 1 SPK using the MKSPK program.
During the archive preparation the positions stored in the file were
dumped using the SPY program and rotated to the HAYABUSA_HP frame.
Then they were plotted in a variety of ways, one of which was the
plot Figure 4 showing the X, Y, and Z components of the Hayabusa
position relative to Itokawa in the HAYABUSA_HP reference frame:
Figure 4
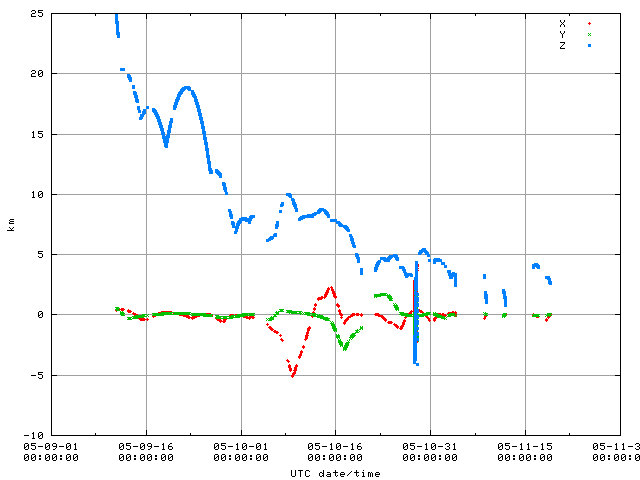 Plotting the data showed a number of gaps -- intervals during which
the file contained no data points but still provided linear
interpolation, likely resulting in grossly incorrect interpolated
positions, -- such as the one seen on this zoom-in plot Figure 5:
Figure 5
Plotting the data showed a number of gaps -- intervals during which
the file contained no data points but still provided linear
interpolation, likely resulting in grossly incorrect interpolated
positions, -- such as the one seen on this zoom-in plot Figure 5:
Figure 5
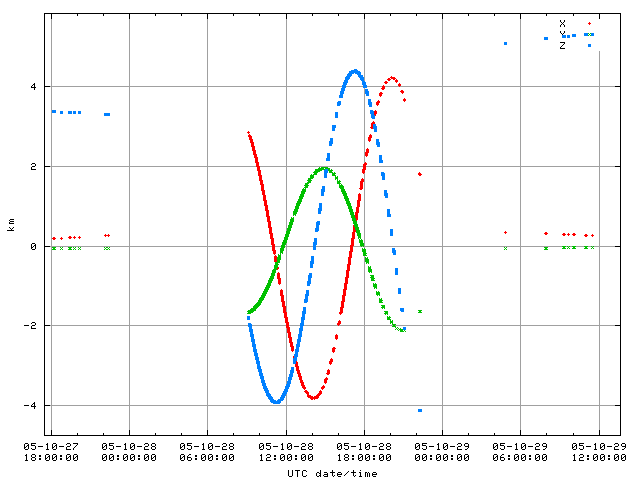
 Moreover the plots showed that the data for October 28, 2005 did
not correctly represent the activities that took place during
operations, with all three position components suggesting that the
spacecraft flew around Itokawa on a slightly inclined circular
trajectory, as seen on this zoom-in plot Figure 6:
Figure 6
Moreover the plots showed that the data for October 28, 2005 did
not correctly represent the activities that took place during
operations, with all three position components suggesting that the
spacecraft flew around Itokawa on a slightly inclined circular
trajectory, as seen on this zoom-in plot Figure 6:
Figure 6
 Finally the velocity components for all points in the SPK were set
to zero, prohibiting the use of the file in any application that
requires velocities consistent (with positions) or at least
realistic.
All of these issues were documented in the comments added to Dr.
Barnouin-Jha's SPK. In addition to that, the dumped data were
"cleaned" to eliminate the points during the anomalous period on
October 28, 2005, augmented with velocities computed using simple
differencing of neighbor positions, split into chunks to prohibit
interpolation over large gaps, and repackaged using the same MKSPK
setup parameters as those that were used to make the original Dr.
Barnouin-Jha's SPK into a new SPK file named
"hay_osbj_050911_051118_v1n.bsp".
CK Files Created by HJST
------------------------
The set of Hayabusa orientation CK files produced by HJST included
84 short-coverage CKs named "hayabusa_YYYYMMDD_yyyymmdd_v01.bc",
covering from one to a few days, produced on a regular basis during
operations at Itokawa, and two long-coverage CKs --
"hayabusa_itokawarendezvous_v01.bc" produced on November 22, 2005
and "20050902-20051126_att.bc" (renamed to
"hayabusa_itokawarendezvous_v02.bc" for the archive) produced on
November 29, 2005, -- each covering the whole period of operations
at Itokawa. Both the short-coverage CKs and the long-coverage CKs
were created by packaging the spacecraft orientation data from
on-board star cameras into Type 3 CK segments using the MSOPCK
program.
During the archive preparation the contents of the short-coverage
and long-coverage HJST CKs were dumped using a custom program and
the dumps were compared to verify that the data stored in the files
indeed came from the same source. The comparison showed that this
was the case and that the total set of points in all short-coverage
CKs and in the earlier long-coverage CK were subsets of points from
the later long-coverage CK. Because of this the later long-coverage
CK was considered as superseding both the short-coverage CKs and the
earlier long-coverage CK and was the only HJST CK used in further
analysis.
The data points dumped from the later long-coverage CK were checked
in a variety of ways for outlier points and consistency with the
nominal pointing modes (implemented using dynamic frames). While
these checks identified a few dozen physically impossible
identity quaternions and quaternions with two perfect zero
components, in general the data seemed to have been consistent with
the pointing modes for major spacecraft activities -- asteroid
observations, Earth communications, etc.
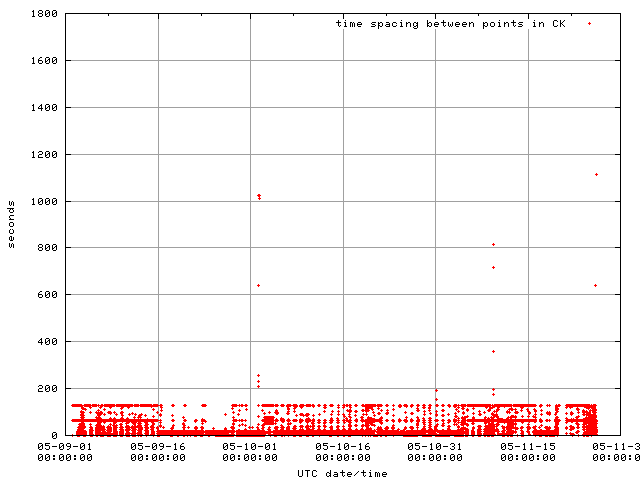
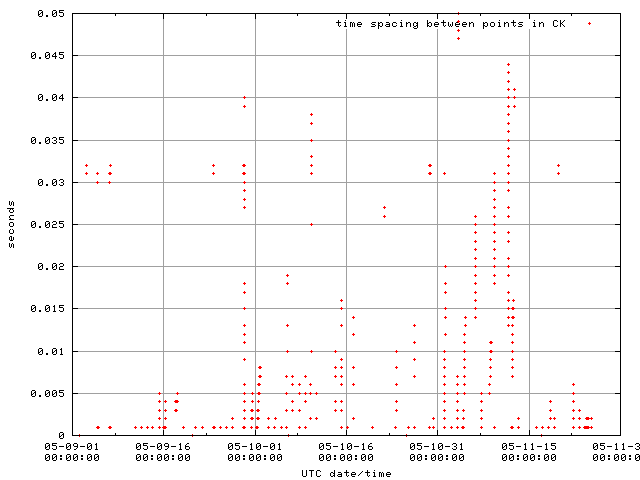
Additional analysis was performed to check the spacing between data
points to confirm that the rather long interpolation interval of
1800 seconds chosen for the CK made sense. This analysis showed that
most of the time, except for a very few cases, the spacing between
points was less that 128 seconds (as seen on the plot Figure 7), which
is adequate to allow interpolation for a three axis stabilized,
slowly rotating spacecraft:
Figure 7
Finally the velocity components for all points in the SPK were set
to zero, prohibiting the use of the file in any application that
requires velocities consistent (with positions) or at least
realistic.
All of these issues were documented in the comments added to Dr.
Barnouin-Jha's SPK. In addition to that, the dumped data were
"cleaned" to eliminate the points during the anomalous period on
October 28, 2005, augmented with velocities computed using simple
differencing of neighbor positions, split into chunks to prohibit
interpolation over large gaps, and repackaged using the same MKSPK
setup parameters as those that were used to make the original Dr.
Barnouin-Jha's SPK into a new SPK file named
"hay_osbj_050911_051118_v1n.bsp".
CK Files Created by HJST
------------------------
The set of Hayabusa orientation CK files produced by HJST included
84 short-coverage CKs named "hayabusa_YYYYMMDD_yyyymmdd_v01.bc",
covering from one to a few days, produced on a regular basis during
operations at Itokawa, and two long-coverage CKs --
"hayabusa_itokawarendezvous_v01.bc" produced on November 22, 2005
and "20050902-20051126_att.bc" (renamed to
"hayabusa_itokawarendezvous_v02.bc" for the archive) produced on
November 29, 2005, -- each covering the whole period of operations
at Itokawa. Both the short-coverage CKs and the long-coverage CKs
were created by packaging the spacecraft orientation data from
on-board star cameras into Type 3 CK segments using the MSOPCK
program.
During the archive preparation the contents of the short-coverage
and long-coverage HJST CKs were dumped using a custom program and
the dumps were compared to verify that the data stored in the files
indeed came from the same source. The comparison showed that this
was the case and that the total set of points in all short-coverage
CKs and in the earlier long-coverage CK were subsets of points from
the later long-coverage CK. Because of this the later long-coverage
CK was considered as superseding both the short-coverage CKs and the
earlier long-coverage CK and was the only HJST CK used in further
analysis.
The data points dumped from the later long-coverage CK were checked
in a variety of ways for outlier points and consistency with the
nominal pointing modes (implemented using dynamic frames). While
these checks identified a few dozen physically impossible
identity quaternions and quaternions with two perfect zero
components, in general the data seemed to have been consistent with
the pointing modes for major spacecraft activities -- asteroid
observations, Earth communications, etc.
Additional analysis was performed to check the spacing between data
points to confirm that the rather long interpolation interval of
1800 seconds chosen for the CK made sense. This analysis showed that
most of the time, except for a very few cases, the spacing between
points was less that 128 seconds (as seen on the plot Figure 7), which
is adequate to allow interpolation for a three axis stabilized,
slowly rotating spacecraft:
Figure 7
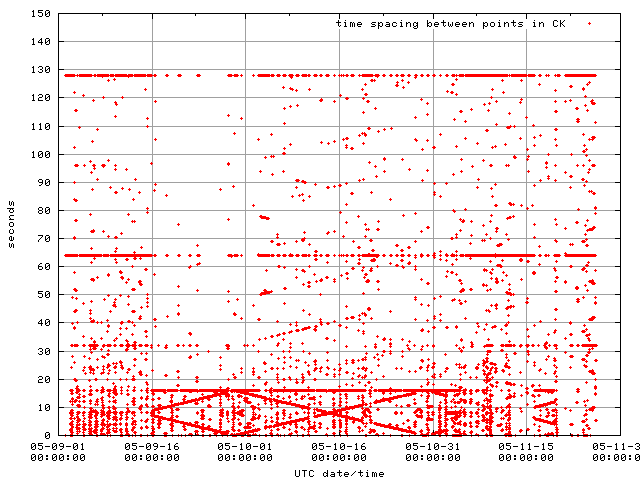
 On the other hand this analysis showed that the data stored in the
file came not from a single, fixed frequency "stream" (a set of
packets generated every 128, 64, or 16 seconds) but from a
combination of two or more asynchronous streams, as suggested by the
diagonal lines on this zoom-in plot Figure 8:
Figure 8
On the other hand this analysis showed that the data stored in the
file came not from a single, fixed frequency "stream" (a set of
packets generated every 128, 64, or 16 seconds) but from a
combination of two or more asynchronous streams, as suggested by the
diagonal lines on this zoom-in plot Figure 8:
Figure 8
 Further zoom-in to a millisecond level indicated that numerous
points in the file were just one to a few milliseconds apart, as
seen on this plot Figure 9:
Figure 9
Further zoom-in to a millisecond level indicated that numerous
points in the file were just one to a few milliseconds apart, as
seen on this plot Figure 9:
Figure 9
 While such close spacing in itself doesn't always indicate a
problem, in the case of Hayabusa it seemed to be an issue due to
possible different on-board delays for the various asynchronous
streams. Because of the possible different delays some of the close
neighbor quaternions appear to be incorrectly time tagged, as seen
in the two examples below in which the quaternions marked by (*)
appear to be out of place compared to the trends established by
their neighbors:
2005-11-03T05:23:09.58000 +0.73761440580137
2005-11-03T05:23:12.76700 +0.73742965636688
2005-11-03T05:23:20.76600 +0.73846154665125 (*)
2005-11-03T05:23:20.76700 +0.73705486031520
2005-11-03T05:23:25.57900 +0.73685107236940
2005-10-20T04:44:49.32500 +0.69323771051346
2005-10-20T04:46:36.41600 +0.68483801616792
2005-10-20T04:46:54.16500 +0.68375293310090
2005-10-20T04:46:54.16600 +0.68483801616792 (*)
2005-10-20T04:46:57.32200 +0.68363023030721
While no acceptable approach was found to correct this particular
issue, a new CK file "hayabusa_itokawarendezvous_v02n.bc" excluding
the non physically possible quaternions and containing made-up
angular velocities to increase the file's usability was created for
the archive using the dumped quaternions and the same MSOPCK setup
parameters as those that were used to make the original
long-coverage HJST CK.
SCLK File Created by HJST
-------------------------
The Hayabusa on-board clock correlation provided in the SCLK file
"hayabusa.tsc" created by HJST was analyzed by comparing it against
the reference, single linear segment correlation trend passing
through the SCLK's first and last correlation points. This reference
correlation trend was encapsulated into an auxiliary SCLK kernel
with clock attributes identical to those of the HJST SCLK kernel
and the following single correlation record:
3.35581810000000e+07 1.05712107715935e+08 0.031249185802
The correlation provided by the HJST and reference SCLK kernels were
compared using a custom program that converted a set of Ephemeris Times
(ETs) to SCLKs using the HJST SCLK kernel, then converted the SCLKs
back to ETs using the reference SCLK kernel, and finally subtracted
the resultant ETs from the input ETs to compute the difference
between correlations. This plot Figure 10 illustrates the difference
over the course of the mission, from launch through the end of
operations at Itokawa:
Figure 10
While such close spacing in itself doesn't always indicate a
problem, in the case of Hayabusa it seemed to be an issue due to
possible different on-board delays for the various asynchronous
streams. Because of the possible different delays some of the close
neighbor quaternions appear to be incorrectly time tagged, as seen
in the two examples below in which the quaternions marked by (*)
appear to be out of place compared to the trends established by
their neighbors:
2005-11-03T05:23:09.58000 +0.73761440580137
2005-11-03T05:23:12.76700 +0.73742965636688
2005-11-03T05:23:20.76600 +0.73846154665125 (*)
2005-11-03T05:23:20.76700 +0.73705486031520
2005-11-03T05:23:25.57900 +0.73685107236940
2005-10-20T04:44:49.32500 +0.69323771051346
2005-10-20T04:46:36.41600 +0.68483801616792
2005-10-20T04:46:54.16500 +0.68375293310090
2005-10-20T04:46:54.16600 +0.68483801616792 (*)
2005-10-20T04:46:57.32200 +0.68363023030721
While no acceptable approach was found to correct this particular
issue, a new CK file "hayabusa_itokawarendezvous_v02n.bc" excluding
the non physically possible quaternions and containing made-up
angular velocities to increase the file's usability was created for
the archive using the dumped quaternions and the same MSOPCK setup
parameters as those that were used to make the original
long-coverage HJST CK.
SCLK File Created by HJST
-------------------------
The Hayabusa on-board clock correlation provided in the SCLK file
"hayabusa.tsc" created by HJST was analyzed by comparing it against
the reference, single linear segment correlation trend passing
through the SCLK's first and last correlation points. This reference
correlation trend was encapsulated into an auxiliary SCLK kernel
with clock attributes identical to those of the HJST SCLK kernel
and the following single correlation record:
3.35581810000000e+07 1.05712107715935e+08 0.031249185802
The correlation provided by the HJST and reference SCLK kernels were
compared using a custom program that converted a set of Ephemeris Times
(ETs) to SCLKs using the HJST SCLK kernel, then converted the SCLKs
back to ETs using the reference SCLK kernel, and finally subtracted
the resultant ETs from the input ETs to compute the difference
between correlations. This plot Figure 10 illustrates the difference
over the course of the mission, from launch through the end of
operations at Itokawa:
Figure 10
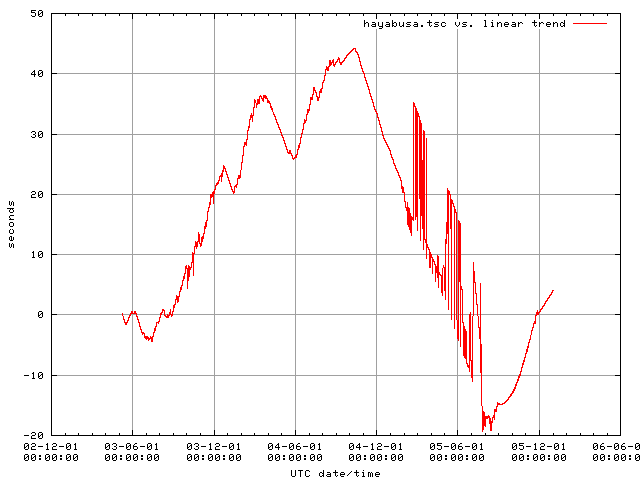 The plot above clearly indicates that the Hayabusa on-board clock
ran at two different rates, apparent from two distinct up and down
global trends, and switched between these rates a few times during
the mission, probably after commands from the ground control center.
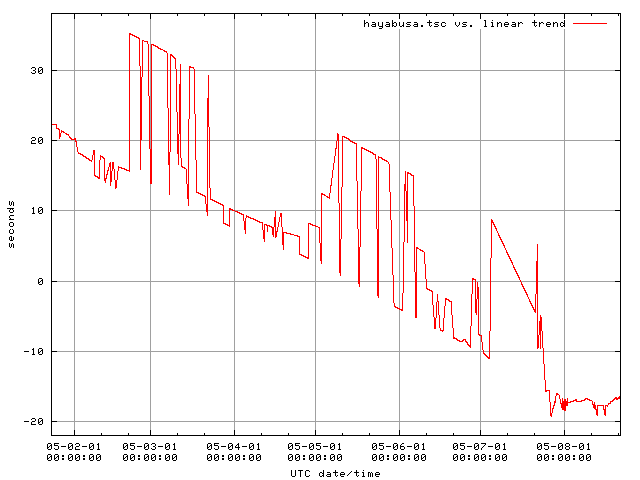
It also indicates a problematic correlation area during the last
third of the cruise to Itokawa, apparent from the up-and-down jumps
of almost twenty seconds seen in this zoom-in plot Figure 11:
Figure 11
The plot above clearly indicates that the Hayabusa on-board clock
ran at two different rates, apparent from two distinct up and down
global trends, and switched between these rates a few times during
the mission, probably after commands from the ground control center.
It also indicates a problematic correlation area during the last
third of the cruise to Itokawa, apparent from the up-and-down jumps
of almost twenty seconds seen in this zoom-in plot Figure 11:
Figure 11
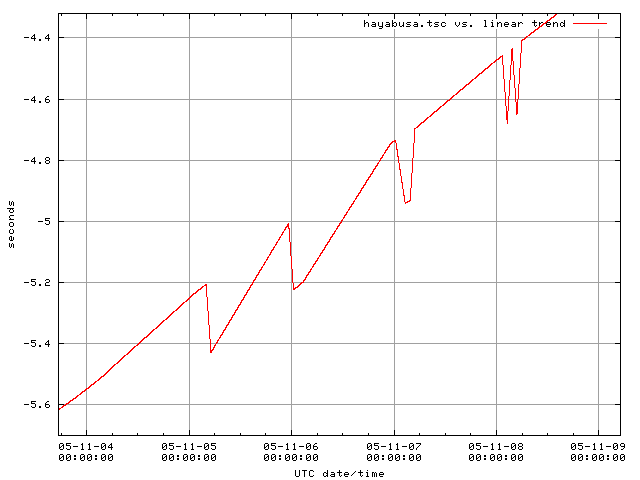
 Fortunately the correlation for the period of operations at Itokawa
looks much more smooth, as seen on this zoom-in plot Figure 12:
Figure 12
Fortunately the correlation for the period of operations at Itokawa
looks much more smooth, as seen on this zoom-in plot Figure 12:
Figure 12
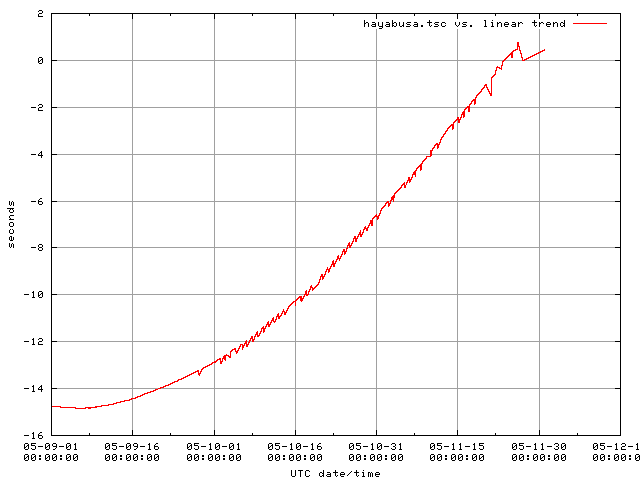 During this period the magnitudes of the "spikes", which are most
likely artifacts of inaccurate input time correlation data and/or
improper modeling in the correlation algorithm, are on the order of
0.2 seconds, as seen on this zoom-in plot Figure 13:
Figure 13
During this period the magnitudes of the "spikes", which are most
likely artifacts of inaccurate input time correlation data and/or
improper modeling in the correlation algorithm, are on the order of
0.2 seconds, as seen on this zoom-in plot Figure 13:
Figure 13
 No attempts to produce an improved version of the HJST SCLK kernel
were made during the archive preparation process.
No attempts to produce an improved version of the HJST SCLK kernel
were made during the archive preparation process.